


Abstract
Dance is believed to be important in the courtship of a variety of species, including humans, but nothing is known about what dance reveals about the underlying phenotypicor genotypicquality of the dancer1, 2, 3, 4, 5, 6. One measure of quality in evolutionary studies is the degree of bodily symmetry (fluctuating asymmetry, FA), because it measures developmental stability7, 8. Does dance quality reveal FA to the observer and is the effect stronger for male dancers than female? To answer these questions, we chose a population that has been measured twice for FA since 1996 (ref. 9) in a society (Jamaican) in which dancing is important in the lives of both sexes. Motion-capture cameras created controlled stimuli (in the form of videos) that isolated dance movements from all other aspects of visual appearance (including FA), and the same population evaluated these videos for dancing ability. Here we report that there are strong positive associations between symmetry and dancing ability, and these associations were stronger in men than in women. In addition, women rate dances by symmetrical men relatively more positively than do men, and more-symmetrical men value symmetry in women dancers more than do less-symmetrical men. In summary, dance in Jamaica seems to show evidence of sexual selection and to reveal important information about the dancer.
Darwin was the first to suggest that dance is a sexually selected courtship signal1. If so, it should reveal genetic or phenotypic quality of the dancer. One such indicator of quality is degree of fluctuating asymmetry (FA), because it is inversely correlated with degree of developmental stability, which is an organism's ability to reach an adaptive end point despite ontogenetic perturbations7, 8, 10, 11. Across diverse taxa, increased FA is associated with increased morbidity, mortality, poor fecundity and other variables linked to natural and sexual selection7, 8. Most germane to the hypothesis that dance reveals underlying developmental stability is evidence that reduced fluctuating asymmetry is associated with locomotory traits or their functional effectiveness in several species, including humans12, 13, 14, 15, 16, 17, 18, 19. Likewise, bodily FA is inversely associated with attractiveness based on a person's odour20, voice21 and facial appearance22. (Note that associations between FA and measures of sexual selection may sometimes be overestimated owing to publication bias and problems associated with small sample size23.)
There are no studies in humans (or any other species) linking variation in dance quality with genetic and/or phenotypic quality. One difficulty is that dance evaluations are potentially confounded by the appearance of the dancerfactors such as clothing, culture, physical attractiveness and FA itself. To control for these potential confounds, we used motion-capture technology commonly used in medical and sport science to extract accurately complex movement24, including dance25 (see Supplementary Video 1 for how stimuli were constructed). Thus we were able to separate the phenotype of dance from the phenotype of the dancer. Motion-capturing of 183 human dancers was conducted in 2004 in Southfield, Jamaica. Each individual danced alone to the same song (popular at the time in Jamaican youth culture) in the same place in front of the same film crew for one minute.
Forty dance animations were chosen on the basis of the level of
fluctuating asymmetry of the dancer, using two measures of FA over time (1996
and 2002). Specifically, individuals in the top third on both FA measures were
categorized 'asymmetrical' (n = 20), while individuals in the bottom
third of both samples were categorized 'symmetrical' (n = 20). This
experimental strategy helped to control for longitudinal changes in FA due to
the accumulation of developmental errors, compensatory growth26
or measurement error. Traits used to calculate composite relative FA were the
elbow, wrist, knee, ankle, foot, third digit, fourth digit, fifth digit and
ears. These traits were measured because they reveal true FA rather than
directional biases, and have proven useful in numerous past studies of FA in
humans9,
20,
21,
22.
Dance animations of symmetrical (Supplementary
Video 2) and asymmetrical (Supplementary
Video 3) individuals were presented randomly to a sample of 155 Jamaican
peers (themselves characterized for FA) for evaluation on a dance rating scale.
No one interviewed afterwards (n = 20) was able to recognize any
individual from his or her motion-capture video. Indeed, correct sex recognition
in the current sample was only 62% .gif) 0.11 (mean s.d.), with female evaluators (64% 0.08) being somewhat better at detecting the sex of the
dancer than male evaluators (60% 0.13) (MannWhitney test, Z = 2.25, P <
0.03). Cronbach's alpha indicated that inter-rater agreement for the dance
rating scale was 0.91 for the entire sample and for both subsamples of correct
versus incorrect sex detections. Finally, there were no effects of correct sex
identifications on the dance evaluations in the current model (see the Supplementary
Background and Analyses). We conclude that evaluators based their judgments
on motion-captured movements and not on recognition of the identity or sex of
the dancer.
0.11 (mean s.d.), with female evaluators (64% 0.08) being somewhat better at detecting the sex of the
dancer than male evaluators (60% 0.13) (MannWhitney test, Z = 2.25, P <
0.03). Cronbach's alpha indicated that inter-rater agreement for the dance
rating scale was 0.91 for the entire sample and for both subsamples of correct
versus incorrect sex detections. Finally, there were no effects of correct sex
identifications on the dance evaluations in the current model (see the Supplementary
Background and Analyses). We conclude that evaluators based their judgments
on motion-captured movements and not on recognition of the identity or sex of
the dancer.
In species where fathers invest less than do mothers in their offspring, females are expected to be more selective in mate choice, and males to invest more in courtship display27. Thus, we predicted that degree of symmetry would more strongly correlate with male dance ability, and females would be better discriminators. Assuming lower quality individuals (higher FA) are less attractive to the opposite sex, there may be selection for such individuals to shift their preferences downward towards individuals more likely to accept them as mates28. Therefore, we tested whether greater FA of evaluators was associated with weaker preferences for symmetrical dancers.
As predicted, there was a significant effect of symmetry
(F1, 34 = 16.34, P < 0.001) and sex (F1,
34 = 10.99, P < 0.005), and there was a significant interaction
between them (F1, 34 = 4.46, P < 0.042) on dance
ability (corrected for the body mass index (BMI) and age of the dancer).
Symmetrical males were evaluated as significantly better dancers (mean s.d. = 57.31 10.65) than asymmetrical males (39.22 9.23), accounting for 48% of the variance in dance
ability (t18 = 4.06, P < 0.001) (Fig.
1a). Even though symmetrical females were significantly better dancers
(45.53 9.47) than asymmetrical females (35.58 9.70), female symmetry only accounted for 23% of dance
ability (t18 = 2.32, P < 0.01). Symmetrical males
were significantly better dancers than symmetrical females
(t18 = 3.21, P < 0.005), but the difference in dance
quality between asymmetrical male and female dancers was not significant
(t18 = 0.79, P > 0.45). (The effect sizes in this
study may be overestimates owing to the extreme group design where dancers were
prescreened for degree of asymmetry, but this bias is not expected to affect the
two sexes differently.) The dancers ranged in age from 14 to 19 years, but
neither age nor BMI had an effect on dancing ability (both F1,
34 < 2.25, P > 0.15).
Figure 1: Symmetry, dance ability and sex differences in evaluators' preferences for symmetry.
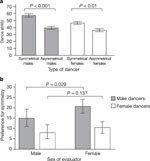
a, Mean dance ability of males (filled bars throughout) and females (open bars throughout) by level of bodily symmetry. Error bars represent 95% confidence intervals. P values for within-sex are shown. b, Mean strength of symmetry preference (that is, evaluations of asymmetrical dancers subtracted from evaluations of symmetrical dancers) by sex of dancer and sex of evaluator. Error bars represent 95% confidence intervals. P value at top of panel indicates significantly greater female than male evaluator preference for symmetrical male dancers.
High resolution image and legend (38K)To test for sex differences between evaluators in the strength of
preference for symmetrical individuals, a variable called 'relative preference
for symmetrical dancers' was constructed by subtracting dance evaluations given
to asymmetrical dancers from the dance evaluations given to symmetrical dancers.
Higher scores indicated stronger preferences for symmetrical dancers relative to
asymmetrical dancers. Female evaluators had a stronger relative preference (Fig.
1b) for symmetrical male dancers (20.43 13.54) than male evaluators (14.90 17.55) (t154 = 2.21, P = 0.029),
while there was no sex difference in dance ratings of symmetrical females
(t154 = 1.50, P = 0.137). However, male evaluators did
give higher ratings to the dances of females (43.75 17.67) than did female evaluators (37.87 15.08) (t154 = 2.19, P =
0.03).
Does fluctuating asymmetry of the evaluator shift preferences away from symmetrical individuals? A multiple regression analysis revealed the predicted association in men (Fig. 2). That is, FA in male evaluators was negatively associated with relative preference for dances performed by symmetrical females. Specifically, changes in male composite relative FA accounted for 11% of the differences in the relative preference for the dances of symmetrical females when age and BMI were included as covariates (partial R2 = 0.11, P = 0.02). There was no significant association between female evaluator FA and preferences for symmetrical males' dances, R2 = 0.02, P = 0.32.
Figure 2: Male evaluator FA and preferences for female symmetry.
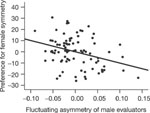
A partial regression plot (age and body mass index controlled) showing a negative relationship between male evaluators' composite relative fluctuating asymmetry and preference for symmetrical female dancers. Both variables in the partial regression plot are residuals.
High resolution image and legend (31K)We do not know what mediates the associations reportedperhaps asymmetry itself or a covarying characteristic such as neuromuscular coordination or health, including freedom from parasites2, 29. Attractive dances may be more difficult to perform, more rhythmic, more energetic, more energy efficient or any combination of these factors. As motion-capture technology stores each dance in a mathematical form, we hope to discover more precisely which patterns of dance movement are associated with both quality of dance and FA of the dancer. Does dance ability correlate with reproductive success? We plan to address this question with long-term data from the same population.
Methods
Fluctuating asymmetry
Morphometric measurements were collected for each dancer (wrists, ankles, elbows, third digit, fourth digit, fifth digit, ears, feet, knees) with vernier calipers to 0.01 mm accuracy (see the methodology in ref. 9) in 1996 and 2002 in Southfield, Jamaica (refer to the Supplementary Background and Analyses for details). To establish repeatability levels and reduce measurement error, each trait was measured twice and averaged9. Bilateral trait measurements were found to be reliable indicators of between-subject differences (as opposed to measurement error), and reflect true FA rather than biologically significant directional asymmetry or antisymmetry (that is, the signed trait asymmetries did not show significant platykurtosis, an indicator of antisymmetry rather than true FA9). Composite relative FA was calculated by subtracting the average length of the right side of the trait from the left (L minus R) and correcting for trait size30, and then summing the absolute values across all traits.
Motion capture
A large sample (n = 183) were filmed with motion-capture cameras under constant conditions: one minute, same music, and danced within a 4-m2 space. An optical motion-capture system from Vicon was chosen owing to the freedom provided to the subject when using lightweight markers. Optical motion-capture systems have been extensively applied in biomechanics for gait analysis and motion research. The system used eight cameras (120-frames-per-second capture rate) in order to capture large amounts of dance movement while removing potential visual confounds (including body size, attractiveness, clothing and identity). These cameras (Supplementary Fig. 1) tracked movements using 41 infrared reflectors (Supplementary Fig. 2). Subjects wore relatively tight clothing to facilitate accurate information from the markers. Reflector trajectories were used to robustly reconstruct joint angles of the three-dimensional (3D) skeletal animation, and transformed this information into a virtual 3D animation. To post-process captured raw data, Vicon IQ 1.5 software was used. The animations were displayed with visualization software developed at the University of Washington. This software used accepted techniques for generating accurate animations from marker positions.
Stimuli presentation
Forty dance animations were selected (20 symmetrical
individuals (10 female, 10 male), mean age = 17.89 1.84, and 20 asymmetrical individuals (10 female, 10
male), mean age = 17.40 1.79). The criterion for selection was that a symmetrical
individual must have been in the bottom third percentile of fluctuating
asymmetry in both 1996 and the 2002 re-measure (the reverse was used for the
asymmetrical category). There were no statistically significant sex differences
in mean or variances in FA between the sexes within a given category (Supplementary
Background and Analyses). Despite the subtle differences in FA between
asymmetrical and symmetrical dancers, the means were statistically different,
all t values were >11.00, all P values were <0.001. The 40
dance animations with audio were randomly presented on a 2-m white background
sequentially using an InFocus DLP
Projector to a sample of 155 young adults (mean age = 18.12 1.75; 87 males, 68 females), also part of the Jamaican
Symmetry Project8,
for evaluation on a 90-mm scale with the left side labelled "Bad Dancer" and the
right side labelled "Good Dancer". Each subject was asked to place a vertical
mark on this scale. Marks were measured to the nearest millimetre by a research
assistant blind with respect to condition. Each subject was also asked to
identify the sex of the dancer in a forced-choice question. To restrict the
study to evaluations of others, we removed 31 self-evaluations (15 male and 16
female) where individuals rated their own dances. The virtual 3D dance
animations were presented in an approximate front-facing angle by an
experimenter blind with respect to condition and hypotheses. Presentation order
was not related to dance evaluations (Pearson r = 0.04, P = 0.82)
or dancer FA (point biserial r = -0.14, P = 0.40).
Statistical analyses
A 2 (Sex of Dancer) .gif) 2 (Symmetry of Dancer) between-subjects ANCOVA (analysis
of covariance), with dance ability as the dependent variable, tested the primary
hypothesis that symmetrical individuals are better dancers (data analysed by SPSS
12.0 from SPSS Inc.). BMI and age were included as covariates. Dance ability
variances were not significantly different, although a marginal difference was
observed whereby males show greater variability in dance ability (180.19) than
do females (113.03) (Levene test F = 3.29, P = 0.08). To
investigate individual differences among evaluators in the strength of symmetry
preference, t-tests were used. Results remain significant when using a
nonparametric MannWhitney test for heterogeneous variances. Multiple regression
analysed whether or not fluctuating asymmetry of evaluators was negatively
associated with relative preference for symmetrical dancers. Age and BMI were
entered as covariates to minimize the influence of these potential confounds.
Neither age nor BMI of dancers nor evaluators were associated with dance ability
or the evaluators' preferences. Finally, the effect of bodily symmetry on dance
ability is independent of facial attractiveness and self-esteem of the dancer
(Supplementary
Background and Analyses).
2 (Symmetry of Dancer) between-subjects ANCOVA (analysis
of covariance), with dance ability as the dependent variable, tested the primary
hypothesis that symmetrical individuals are better dancers (data analysed by SPSS
12.0 from SPSS Inc.). BMI and age were included as covariates. Dance ability
variances were not significantly different, although a marginal difference was
observed whereby males show greater variability in dance ability (180.19) than
do females (113.03) (Levene test F = 3.29, P = 0.08). To
investigate individual differences among evaluators in the strength of symmetry
preference, t-tests were used. Results remain significant when using a
nonparametric MannWhitney test for heterogeneous variances. Multiple regression
analysed whether or not fluctuating asymmetry of evaluators was negatively
associated with relative preference for symmetrical dancers. Age and BMI were
entered as covariates to minimize the influence of these potential confounds.
Neither age nor BMI of dancers nor evaluators were associated with dance ability
or the evaluators' preferences. Finally, the effect of bodily symmetry on dance
ability is independent of facial attractiveness and self-esteem of the dancer
(Supplementary
Background and Analyses).