|
1
|
|
|
2
|
|
|
3
|
|
|
4
|
|
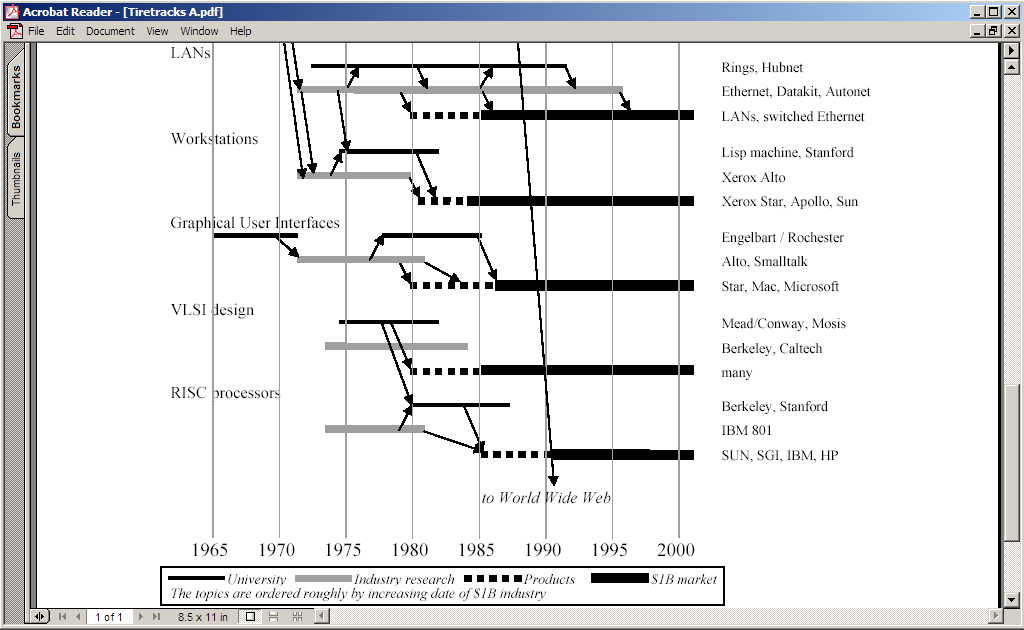
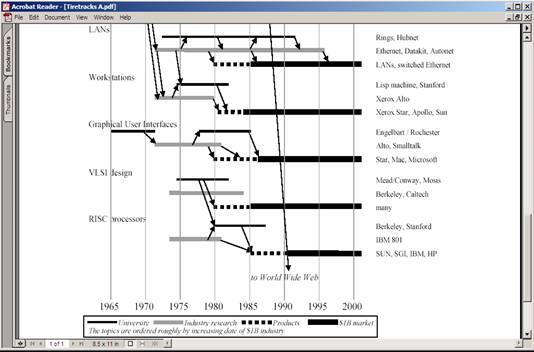
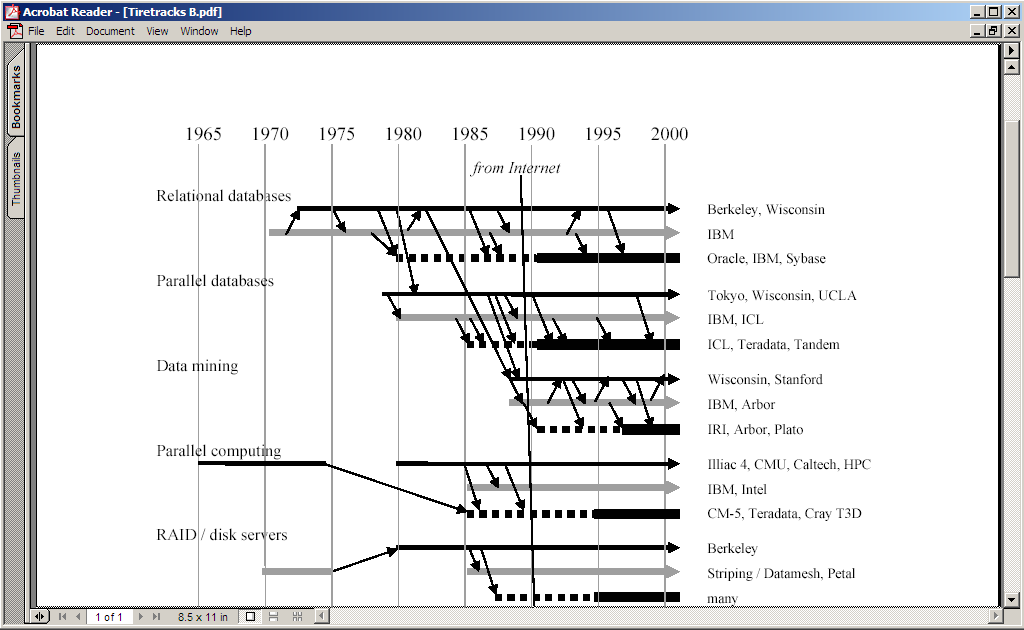
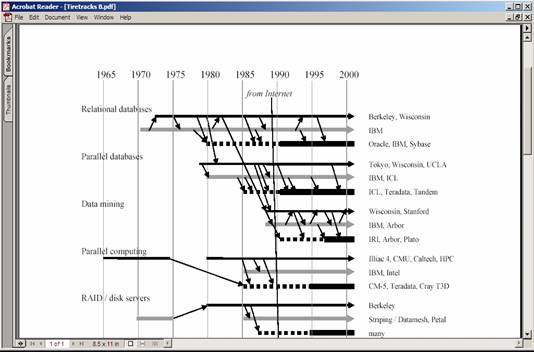
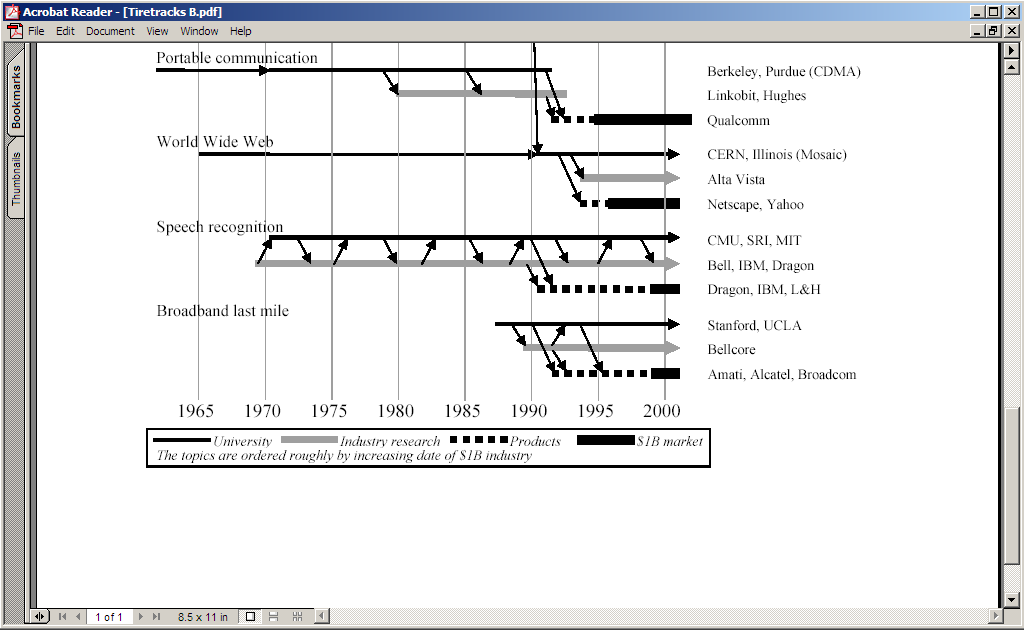
|
5
|
|
|
6
|
|
|
7
|
|
|
8
|
- The envelope, please ...
- Compared to 8 “peer states”:
- California
- Colorado
- Georgia
- Maryland
- Massachusetts
- Michigan
- Texas
- Virginia
|
|
9
|
|
|
10
|
|
|
11
|
|
|
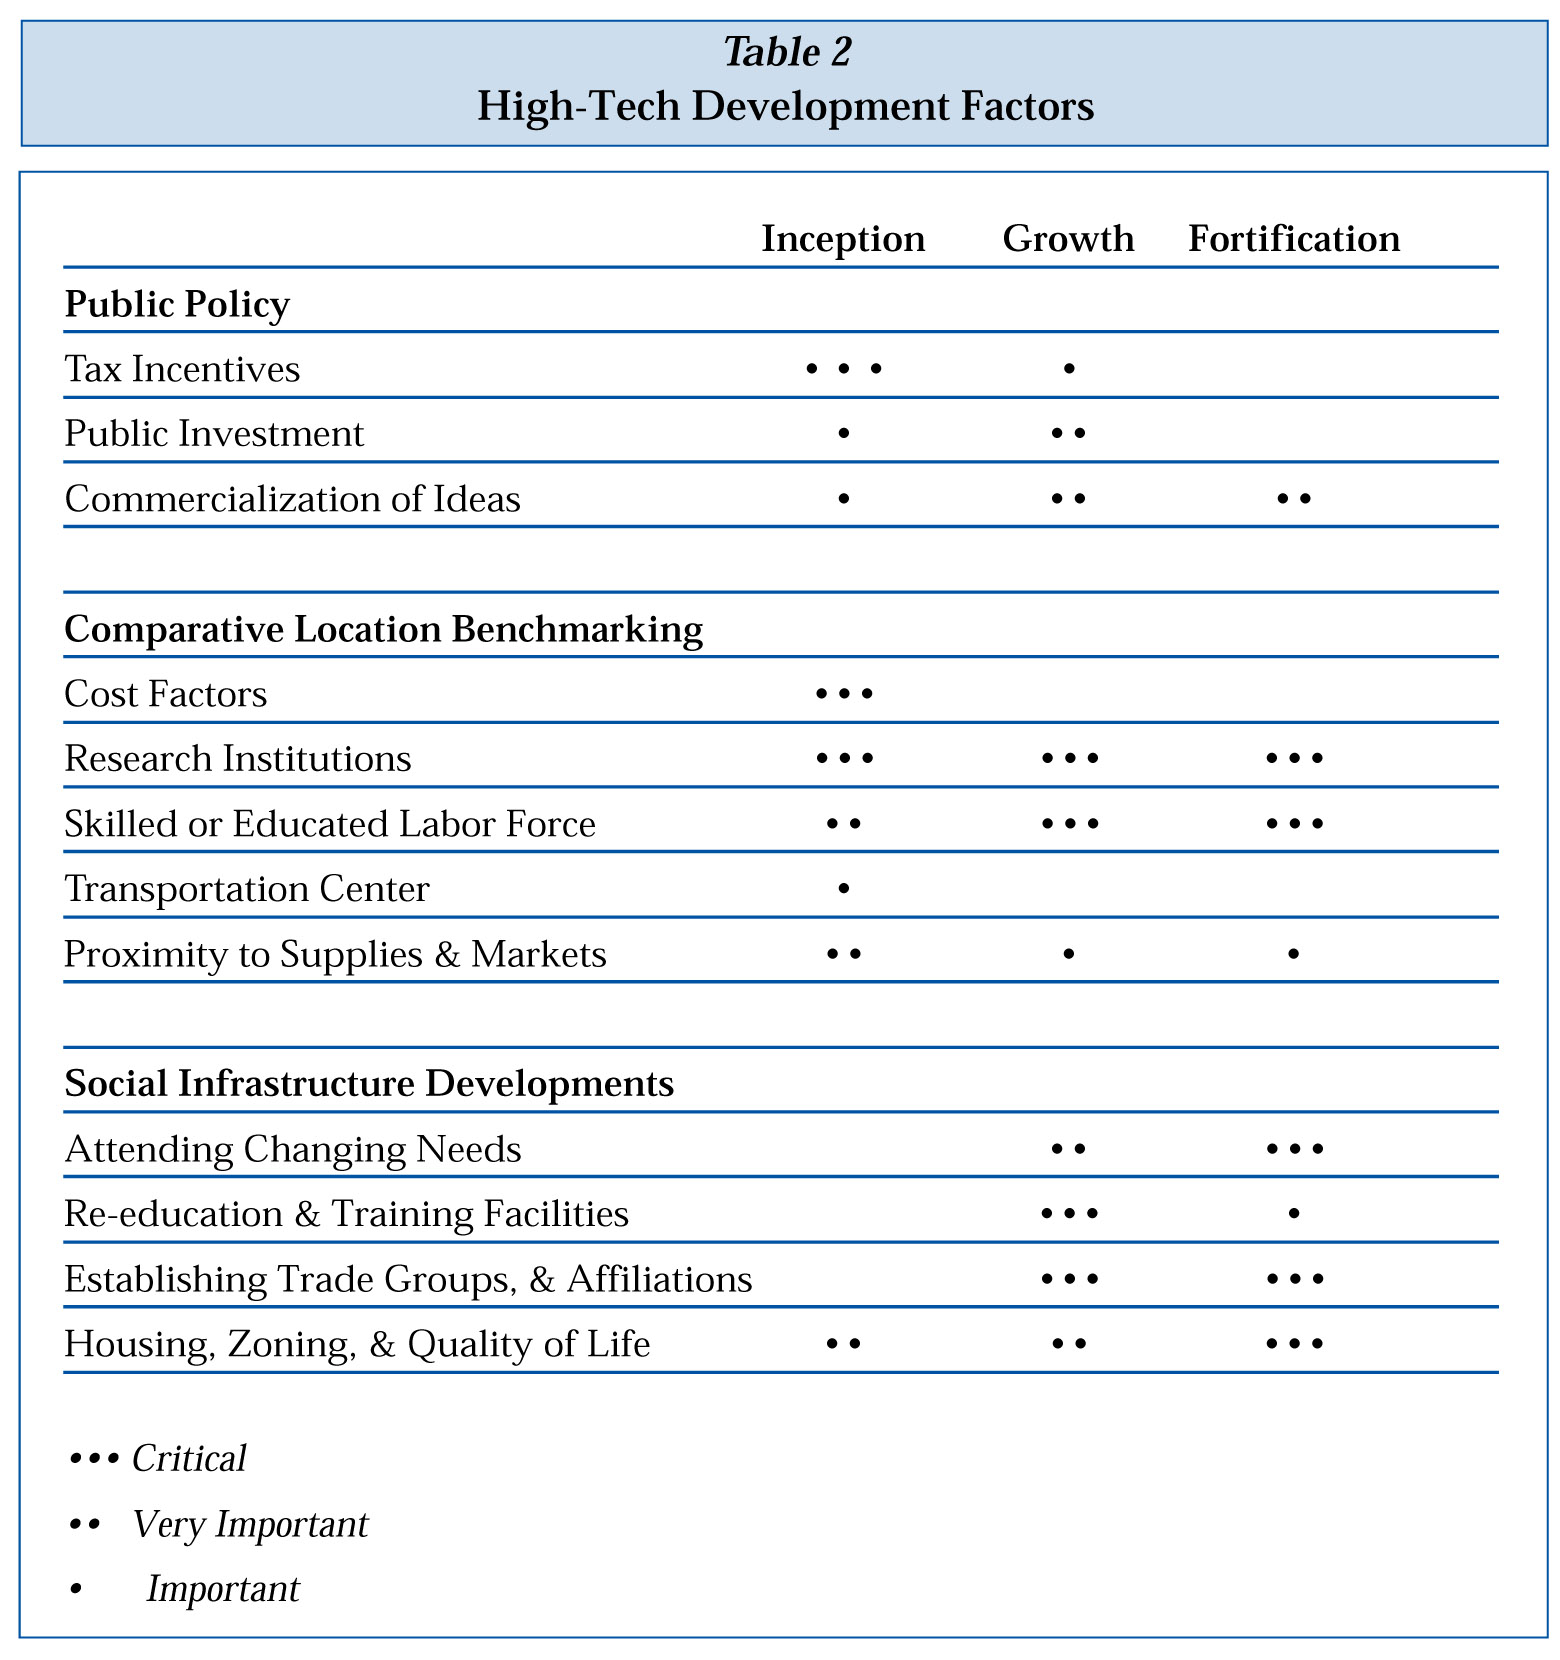
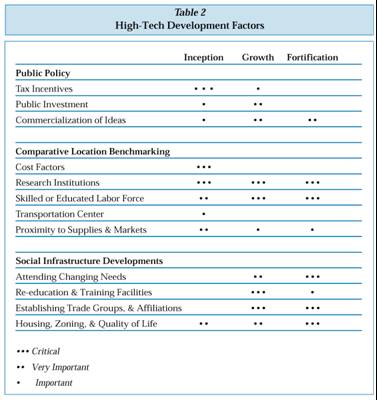
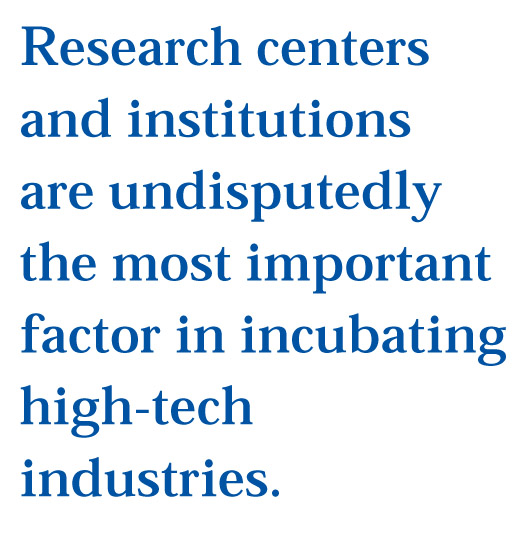
12
|
- Higher education and research institutions
- Ideas and people to drive the innovation economy
|
|
13
|
|
|
14
|
- Boston: MIT, Harvard
- Research Triangle Park: Duke, UNC, NC State
- Austin: University of Texas
- So. California: UCSD, UCLA,
Caltech
- No. California: Stanford,
Berkeley, UCSF
- Puget Sound region: University of
Washington
|
|
15
|
- Education
- Technology attraction
- Company attraction
- Innovation (technology creation)
- Entrepreneurship (company creation)
- Leadership and intangibles
|
|
16
|
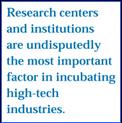
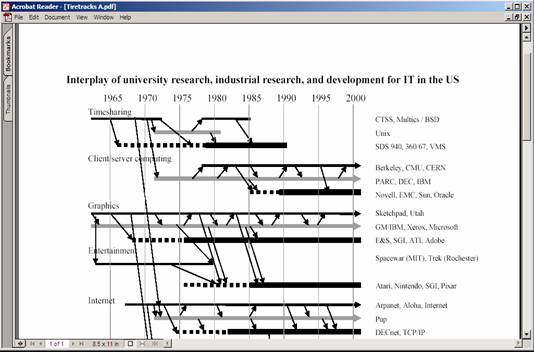
- America’s leadership arises from a complex partnership among industry,
academia, and government
- Federally-sponsored university-based research played a key role in
essentially every technology upon which we rely today
|
|
17
|
|
|
18
|
|
|
19
|
|
|
20
|
|
|
21
|
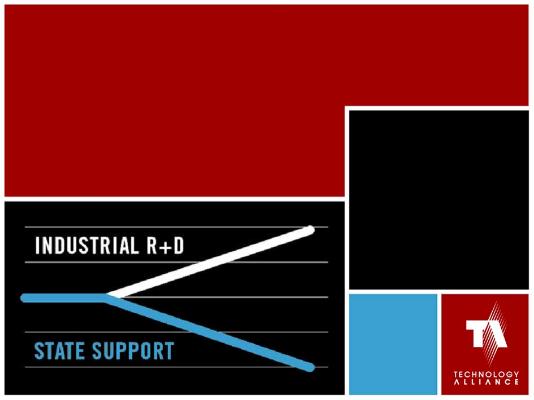
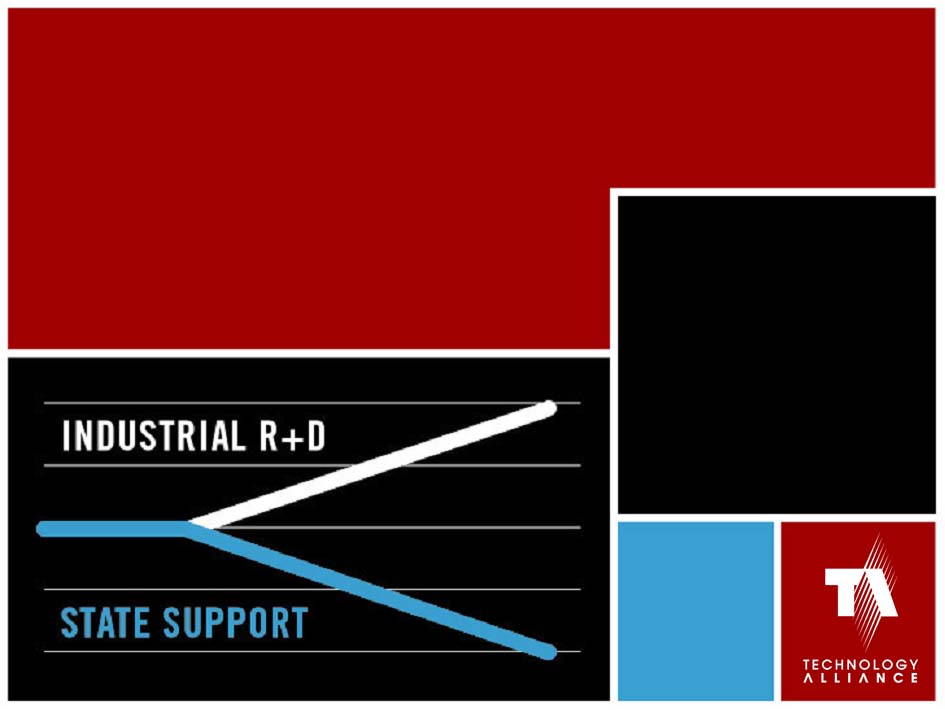
- Entirely appropriately, industry R&D is heavily focused on D –
product and process development
- Microsoft’s investment in Microsoft Research – unquestionably one of
the world’s great IT research enterprises – is nearly unique
- And MSR – the part of Microsoft’s R&D enterprise that’s looking
more than 18 months ahead – represents <5% of Microsoft’s total
R&D
|
|
22
|
- Ranked among the top ten programs in the nation since the 1980s
- In research
- In graduate education
- In undergraduate education
|
|
23
|
- Emma Brunskill, Computer Engineering ‘00: 2001
- Rhodes Scholar
- Kevin Zatloukal, Computer Science ‘01: 2001 Computing Research
Association “Outstanding Undergraduate” national winner
|
|
24
|
- William Chan, Ph.D. ’00, and Mike Ernst, Ph.D. ’00: Two of the three
students in the nation recognized in the 2001 ACM Outstanding Doctoral
Dissertation Award competition
- Stefan Savage, Ph.D. ‘01: Faculty offers from MIT, Stanford, Berkeley,
Carnegie Mellon, Cornell, UCSD, ...
|
|
25
|
- UW is the nation’s #1 supplier of new college graduates to Microsoft
- UW is also the nation’s #1 supplier to Intel (among Intel’s “focus
schools”)
- UW is the nation’s #2 supplier to IBM
- UW is the predominate supplier to many outstanding regional firms (e.g.,
BSQUARE)
|
|
26
|
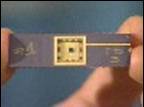
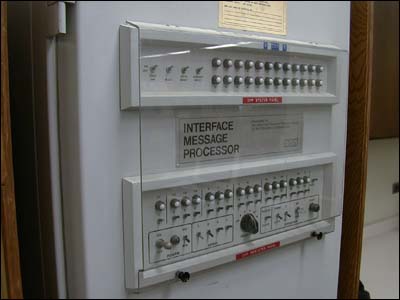
- Brought ARPANET and modern VLSI design to the region
|
|
27
|
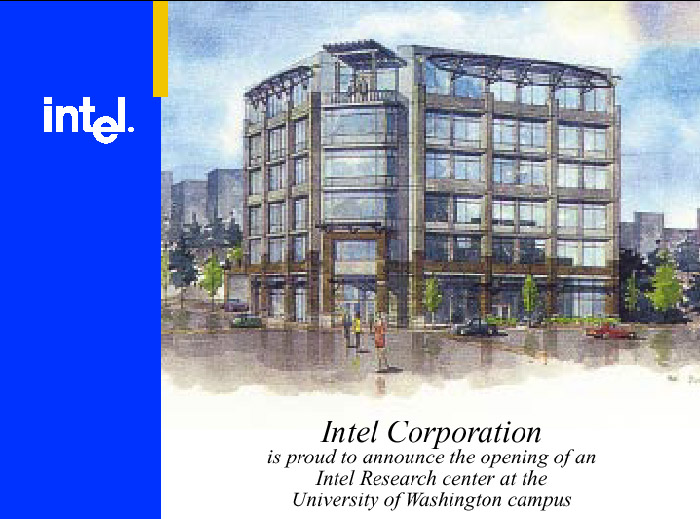
- A long history (DECwest, Tera/Cray, Geoworks, …), most recently Intel
Research
|
|
28
|
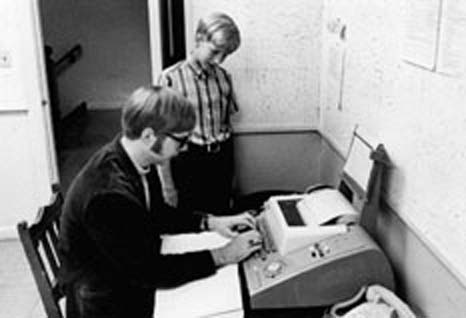
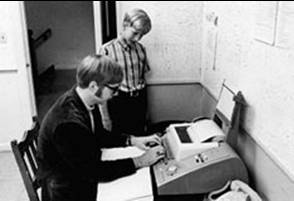
- Early alums (co-)founded Aldus, Visio, IC Designs, Dialogic, Digital
Research, Pixar ...
|
|
29
|
|
|
30
|
|
|
31
|
- Undergraduate:
- Ranked in the top 50 among 249 “National Universities – Doctoral” by US
News (13th among publics)
- Various programs (incl. CSE) ranking among the top ten in their fields
- Graduate/Research:
- Annually among the top five universities in the nation in federal
research expenditures (and the #1 public university) for more that 25
years
- Also a leader in all measures related to technology transfer and
entrepreneurship
|
|
32
|
- 1. Johns Hopkins (55% is APL)
- 2. University of Washington
- 3. Stanford
- 4. University of Michigan
- 5. MIT
- 6. UCSD
- 7. University of Pennsylvania
- 8. Harvard
- 9. UCLA
- 10. University of Wisconsin
|
|
33
|
- 1. Duke (largely clinical trials)
- 2. MIT
- 3. Penn State
- 4. Georgia Institute of Technology
- 5. Ohio State University
- 6. University of Washington
- 7. University of Texas at Austin
- 8. UCSF
- 9. Texas A&M University
- 10. University of Michigan
|
|
34
|
- 1. Johns Hopkins
- 2. University of Michigan
- 3. University of Washington
- 4. UCLA
- 5. University of Wisconsin
- 6. UCSD
- 7. UC Berkeley (includes Energy labs)
- 8. Stanford
- 9. MIT
- 10. UCSF
|
|
35
|
- 1. Columbia
- 2. University of California System (9-campus system)
- 3. Florida State University
- 4. Yale
- 5. University of Washington
- 6. Stanford
- 7. Michigan State University
- 8. University of Florida
- 9. University of Wisconsin
- 10. MIT
|
|
36
|
- 1. University of Washington
- 2. MIT
- 3. Stanford
- 4. Iowa State University
- 5. Columbia
- 6. Purdue
- 7. University of Wisconsin
- 8. Harvard
- 9. University of Minnesota
- 10. State University of New York System
|
|
37
|
- 1. University of California System (9-campus system)
- 2. MIT
- 3. Stanford
- 4. Caltech
- 5. University of Texas at Austin
- 6. University of Washington
- 7. University of Wisconsin
- 8. Columbia
- 9. University of Michigan
- 10. Johns Hopkins
|
|
38
|
- 1. MIT
- 1. UW
- 3. Stanford
- 3. Wisconsin
- 5. Michigan
- 6. Hopkins
- 7. Columbia
|
|
39
|
- Once upon a time, the “content” of the goods we produced was largely
physical
|
|
40
|
- Then we transitioned to goods whose “content” was a balance of physical
and intellectual
|
|
41
|
- In the “innovation economy,” the content of goods is almost entirely
intellectual rather than physical
|
|
42
|
- Every state consumes “innovation economy” goods
- Information technology, biotechnology, telecommunications, …
- Our state produces these goods!
- Over the past 20 years, the Puget Sound region has had the fastest
pro-rata growth in the nation in the “high tech services” sector
|
|
43
|
- National and regional studies conclude the 3/4ths of the jobs
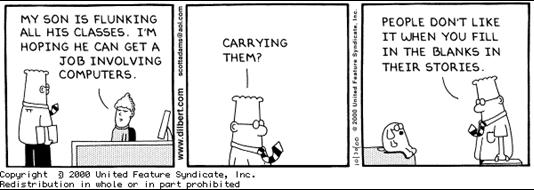
in software require a Bachelors degree or greater (and it’s highly
competitive among those with this credential!)
|
|
44
|
|
|
45
|
- In Washington State:
- We rank 48th out of the 50 states in the participation rate in public
4-year higher education (1997 federal data presented by OFM)
- We rank 41st in upper-division enrollment – “Bachelors
degree granting capacity” – still in the bottom 20% of states
- We rank 4th in community college participation
- Washington’s public higher education system is structured for a
manufacturing economy, not an innovation economy!
|
|
46
|
- On a per capita basis, Washington ranks 32nd among the
states in the number of Bachelors degrees granted by all colleges and
universities, public and private, and 35th in the percentage
of our Bachelors degrees that are granted in science and engineering (1997-98
data, Dept. of Ed.)
- Private institutions are not filling the gap
|
|
47
|
- We rank 43rd in graduate and professional participation rate
at public institutions (1997 federal data presented by OFM)
- We rank 41st in the number of students pursuing graduate
degrees in science and engineering at all institutions, public and
private (1999 data, NSF)
- At the graduate level, things are just as grim
|
|
48
|
- We rank 5th in the nation in the percentage of our workforce
with a recent Bachelors degree in science or engineering, and 6th
in the percentage of our workforce with a recent Masters degree in
science or engineering (1999 data, NSF; “recent degree” = 1990-98)
- We are creating the jobs – and we are importing young people from
elsewhere to fill them!
|
|
49
|
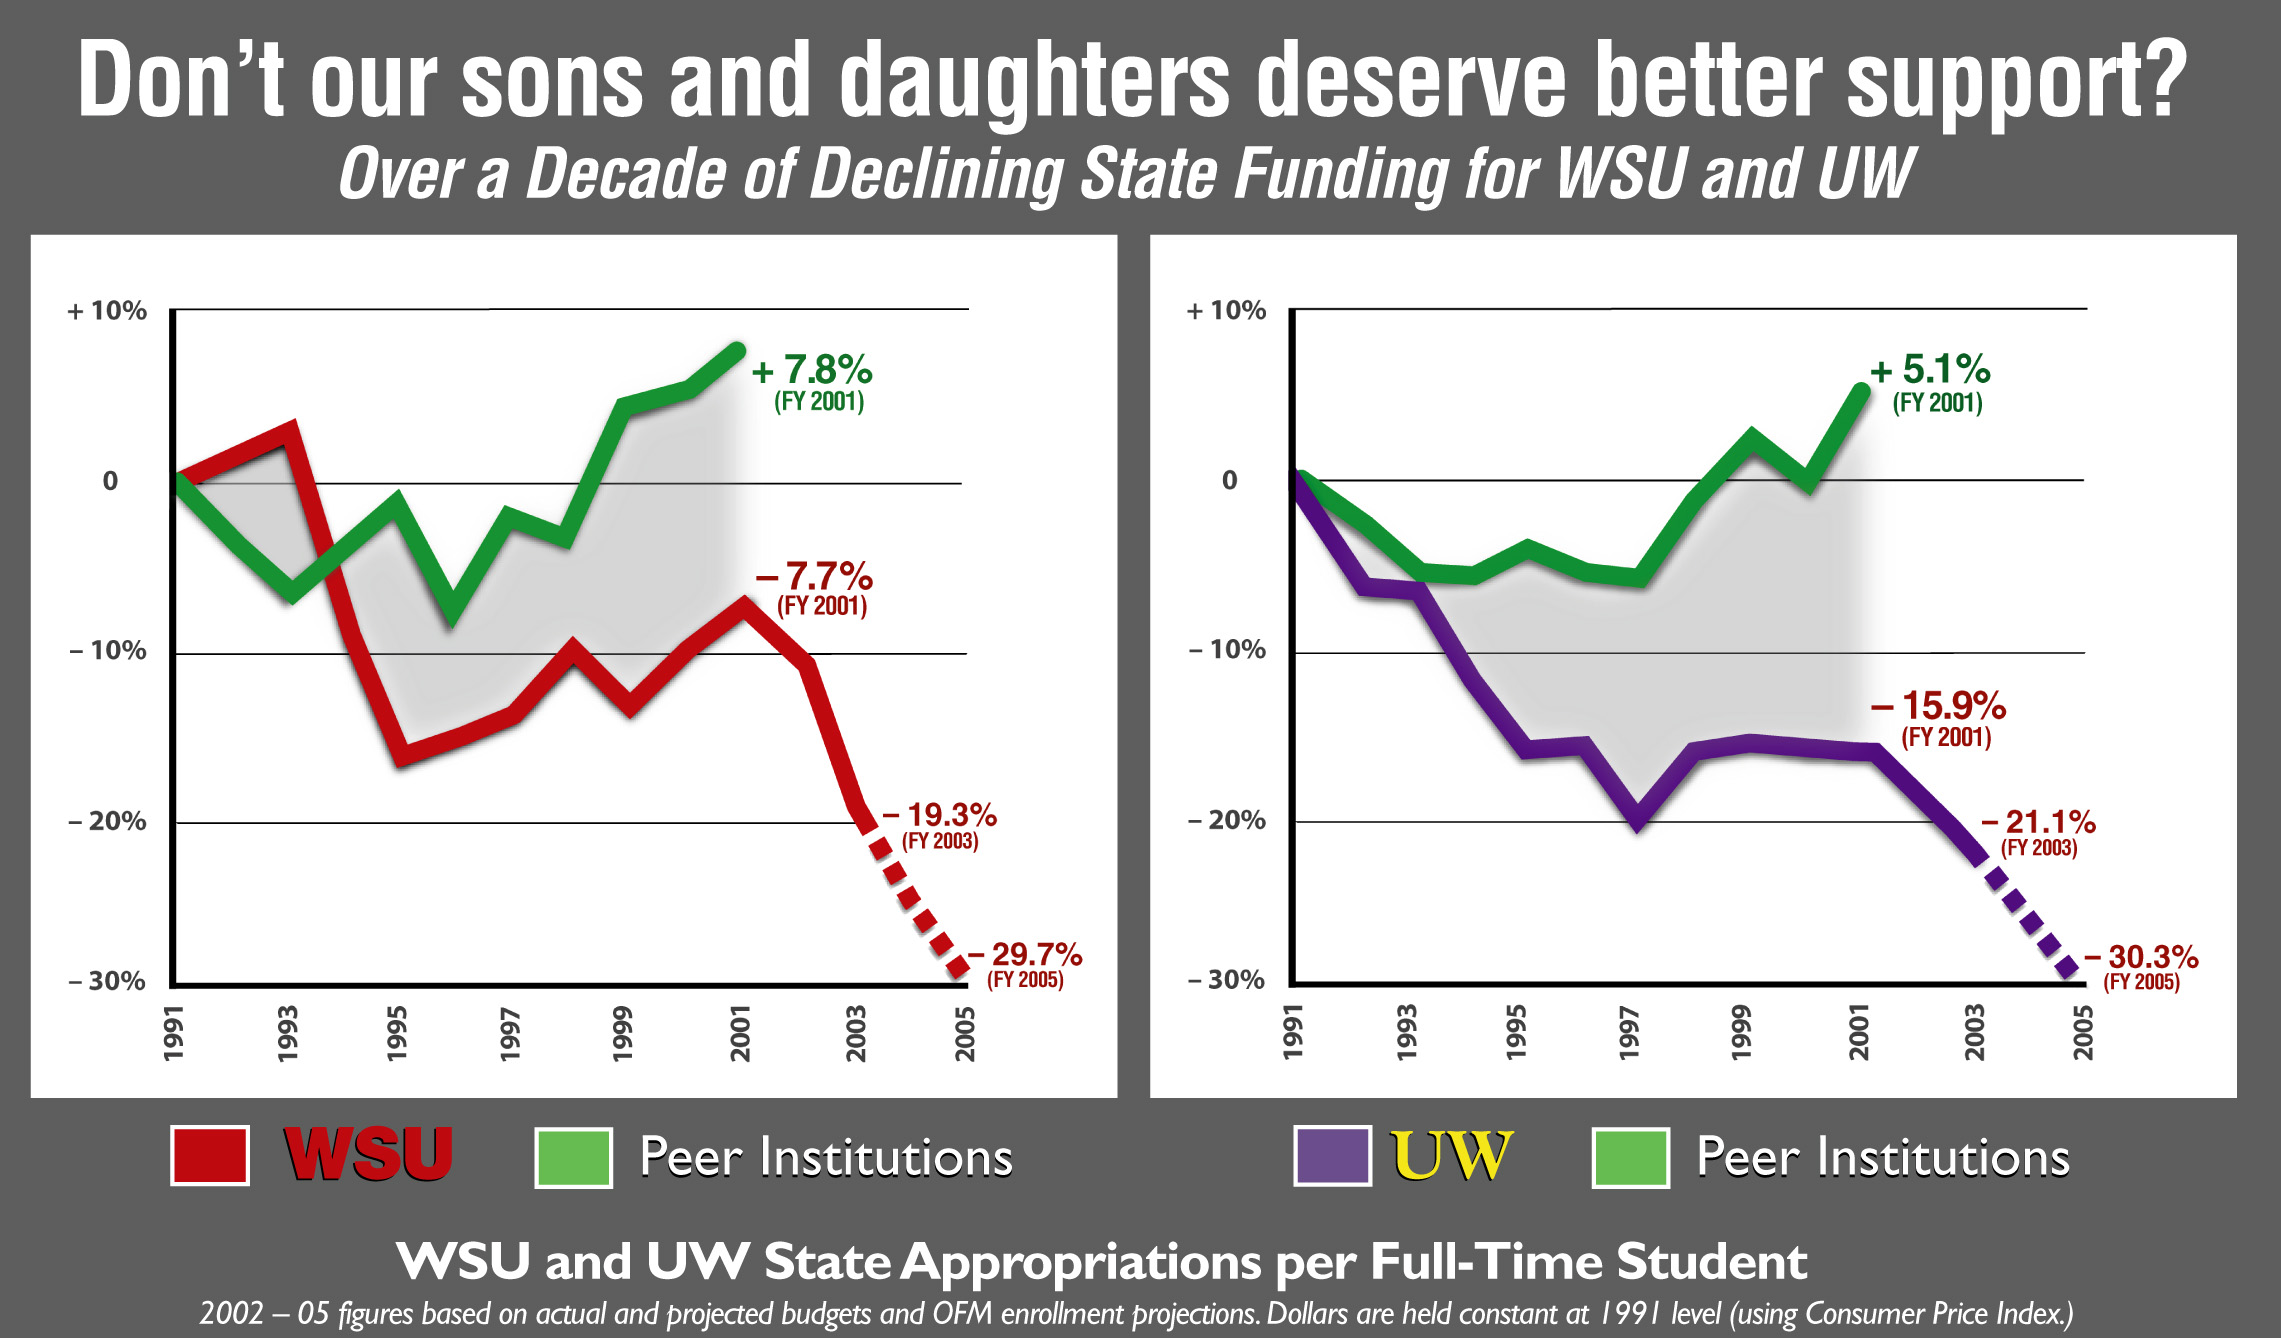
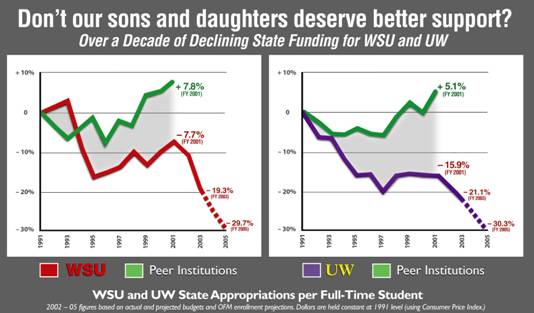
- UW’s state funding per student is ~25% below the average of its
Olympia-defined “peers” (22% behind 24 HECB peers, 26% behind 8 OFM
peers) (1999-2000 data, IPEDS)
- In 1976, Washington spent $14.35 on higher education per $1,000 of
personal income; by 2001, that number had dropped by nearly a factor of
two – to $7.65 (Postsecondary Educational Opportunity #115)
- We under-fund the relatively few student places we have. And it’s
getting worse
|
|
50
|
|
|
51
|
- Washington ranks 46th out of the 50 states in state support
for research
- This is the relatively modest “seed corn” from which large-scale
federally-funded research programs grow
|
|
52
|
- Washington State is all geared up to fight the last war!
|
|
53
|
- I recently returned from 6 months at UCSD, in the Jacobs School of
Engineering
- UCSD Engineering faculty increased by 55 between 1994 and 2001, with an
additional 40 committed by 2005, as part of a statewide plan to
increase overall UC engineering enrollment by 40%
- 471,000 GSF of new UCSD Engineering facilities are currently under
construction, 75% state-funded (partly as UCSD’s share of the 4 $100M
“California Institutes for Science and Innovation”)
- A new state-funded CSE building was one of six state-funded UC
buildings just accelerated by 1 year with an “economic development”
rationale
|
|
54
|
- I’m on the Advisory Board for the College of Computing at Georgia Tech
- HOPE Scholarship program – begun in 1993
- Full tuition scholarships to state institutions for all residents who
maintain a B average
- Funded by lottery
- Since 1993, >500,000 recipients, >$1B disbursed
- Incoming GaTech SAT scores up from 1230 to 1330
- Yamacraw initiative in CS/CompE/EE – begun in 1999
- 90 new faculty in CS/CompE/EE – half at GaTech
- 600 new graduates per year in these fields – half at GaTech
- 200K ASF building at GaTech
- $5M annual research funding
- $5M one-time venture fund
|
|
55
|
- High-tech success involves a complex ecology featuring rich interactions
among universities, government, and industry
- In all honesty, you pretty much have to live it to grasp it in a
balanced way
- But there are a number of good studies, e.g., 1995 National Research
Council report on innovation in information technology
- Our state needs to get its act together!
- Not for me, not for UW, not for today’s companies
- For the future that we are creating for our kids
|
|
56
|
|

 Notes
Notes